Problem
You attempt to connect to the login page of a vCenter 6.5 server via the vSphere Web Client but receive the following error message from the browser:
503 Service Unavailable (Failed to connect to endpoing: [class Vmacore::Http::NamedPipeServiceSpec:0x00000263204438b0] _serverNamespace = / action = Allow _pipeName =\\.\pipe\vmware-vpxd-webserver-pipe)
Solution
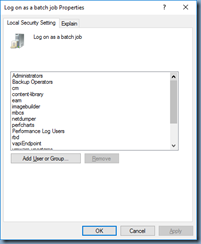
While there are a possible causes for this error, one of the reasons why the message is presented is if the Postgres database is unable to start thus causing the vCenter login portal to not load. For this example, the reason why the Postgres database engine would not start is because the Windows Server hosting the vCenter services and Postgres database had the security permissions for the Log on as a batch job overwritten by a group policy in the domain. This is what was displayed when I checked the vCenter Windows Server Log on as a batch job policy accounts:
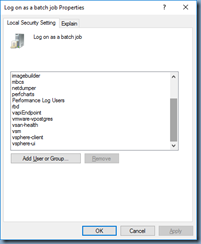
Adding the following local server accounts back in corrected the issue:
- cm
- content-library
- eam
- imagebuilder
- mbcs
- netdumper
- perfcharts
- rbd
- vapiEndpoint
- vmware-vpostgres
- vsan-health
- vsm
- vsphere-client
- vsphere-ui
The list of the accounts above were obtained in the following KB:
Error "Logon failure: the user has not been granted the requested logon type at this computer" (2148054)
https://kb.vmware.com/s/article/2148054
Troubleshooting
This issue took quite a bit of time traversing through various logs to determine the root cause and I did not want to include all the information in the solution section in case the reader needed the remediation quickly so I will put them here.
The first logs I reviewed were the vCenter logs on the Windows server located here:
C:\ProgramData\VMware\vCenterServer\logs\vmware-vpx
I opened up the latest vpxd log and managed to find a line indicating there was an error authenticating the administrator@vsphere.local account:
2018-10-06T05:44:52.744+01:00 error vpxd[04128] [Originator@6876 sub=User opID=5aa4e999] Failed to authenticate user <administrator@vsphere.local>
Doing a bit of searching for this error directed me to this KB article:
Logging in to the vCenter Server Appliance fails with the error: Failed to authenticate user (2147174)
https://kb.vmware.com/s/article/2147174
… but I quickly determined that it did not apply to this issue.
Continuing to review the logs revealed the following lines that appear to suggest there may be a problem with the Postgres SQL database:
2018-10-06T05:44:46.752+01:00 error vpxd[09488] [Originator@6876 sub=Default opID=HB-host-15@26976-e46a4d] [VdbStatement] SQL execution failed: DELETE FROM VPX_IP_ADDRESS WHERE ENTITY_ID = ?
2018-10-06T05:44:46.752+01:00 error vpxd[09488] [Originator@6876 sub=Default opID=HB-host-15@26976-e46a4d] [VdbStatement] Execution elapsed time: 4113 ms
2018-10-06T05:44:46.752+01:00 error vpxd[09488] [Originator@6876 sub=Default opID=HB-host-15@26976-e46a4d] [VdbStatement] Statement diagnostic data from driver is 57P01:0:34:Could not receive the response, communication down ??;
--> Could not send Query(connection dead)
2018-10-06T05:44:46.752+01:00 error vpxd[09488] [Originator@6876 sub=Default opID=HB-host-15@26976-e46a4d] [VdbStatement] Bind parameters:
2018-10-06T05:44:46.752+01:00 error vpxd[09488] [Originator@6876 sub=Default opID=HB-host-15@26976-e46a4d] [VdbStatement] [0]datatype: 1, size: 4, arraySize: 0
2018-10-06T05:44:46.752+01:00 error vpxd[09488] [Originator@6876 sub=Default opID=HB-host-15@26976-e46a4d] [VdbStatement] value = 115
2018-10-06T05:44:47.152+01:00 warning vpxd[06528] [Originator@6876 sub=VpxProfiler opID=ProcessTaskNotifications-56e509fe] ProcessTaskNotifications [TotalTime] took 5070750068 ms
2018-10-06T05:44:47.153+01:00 warning vpxd[09280] [Originator@6876 sub=VpxProfiler opID=ProcessEventNotifications-6058ed8] ProcessEventNotifications [TotalTime] took 5070750084 ms
2018-10-06T05:44:47.228+01:00 warning vpxd[09432] [Originator@6876 sub=VpxProfiler opID=ProcessScheduledTaskFiring-1c06dac8] ProcessScheduledTaskFiring [TotalTime] took 5070750086 ms
2018-10-06T05:44:49.538+01:00 info vpxd[09552] [Originator@6876 sub=SupportMgr] Wrote uptime information
2018-10-06T05:44:49.603+01:00 error vpxd[09552] [Originator@6876 sub=Default] [VdbStatement] Execute result code: -1
2018-10-06T05:44:49.603+01:00 error vpxd[09552] [Originator@6876 sub=Default] [VdbStatement] SQL execution failed: SELECT count(1) as TOTAL FROM VPX_DATACENTER
2018-10-06T05:44:49.603+01:00 error vpxd[09552] [Originator@6876 sub=Default] [VdbStatement] Execution elapsed time: 30 ms
2018-10-06T05:44:49.603+01:00 error vpxd[09552] [Originator@6876 sub=Default] [VdbStatement] Statement diagnostic data from driver is 08S01:0:34:Could not receive the response, communication down ??;
From here, I went ahead to launch the ODBC Data Source Administrator (64-bit) to check the System DSN that connected to the PostgreSQL database, ran the test connection and immediately noticed that it was not accessible:
A bit more searching lead me to the following KB:
Connecting to the embedded vPostgres Database in a Windows installed vCenter Server 6.0 (2108848)
https://kb.vmware.com/s/article/2108848
Using the instructions provided in the KB, I navigated to the following directory to review the vcdb.properties file with the PostgreSQL database information:
C:\ProgramData\VMware\vCenterServer\cfg\vmware-vpx
Then launched the command prompt, navigated to the following directory:
C:\Program Files\VMware\vCenter Server\vPostgres\bin\
Then attempted to connect to the database with the following command:
psql -U username vc VCDB
… but quickly got the same error as the ODBC system DSN connection attempt:
From here, I navigated to the vCenter’s bin folder:
C:\Program Files\VMware\vCenter Server\bin
… then used the following command to list the status of the vCenter services:
service-control --status
The output above is not what is to be expected from a healthy vCenter and seeing the vPostgres service Stopped confirms the unavailability of the database that vCenter would require to start up properly.
-------------------------------------------------------------------------------------------------------------------------------------------------------
Note that this is what the status on a healthy VCSA service status should look like:
Command> service-control --status
Running:
applmgmt lwsmd pschealth vmafdd vmcad vmdird vmdnsd vmonapi vmware-cis-license vmware-cm vmware-content-library vmware-eam vmware-perfcharts vmware-psc-client vmware-rhttpproxy vmware-sca vmware-sps vmware-statsmonitor vmware-sts-idmd vmwa re-stsd vmware-updatemgr vmware-vapi-endpoint vmware-vmon vmware-vpostgres vmwar e-vpxd vmware-vpxd-svcs vmware-vsan-health vmware-vsm vsphere-client vsphere-ui
Stopped:
vmcam vmware-imagebuilder vmware-mbcs vmware-netdumper vmware-rbd-watchdog vmwa re-vcha
Command>
-------------------------------------------------------------------------------------------------------------------------------------------------------
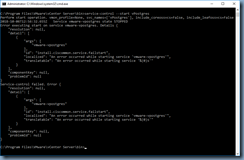
Attempting to manually start the vPostgres service with the following command shows that it immediately fails:
service-control --start vPostgres
C:\Program Files\VMware\vCenter Server\bin>service-control --start vPostgres
Perform start operation. vmon_profile=None, svc_names=['vPostgres'], include_coreossvcs=False, include_leafossvcs=False
2018-10-06T12:56:32.655Z Service vmware-vpostgres state STOPPED
Error executing start on service vmware-vpostgres. Details {
"resolution": null,
"detail": [
{
"args": [
"vmware-vpostgres"
],
"id": "install.ciscommon.service.failstart",
"localized": "An error occurred while starting service 'vmware-vpostgres'",
"translatable": "An error occurred while starting service '%(0)s'"
}
],
"componentKey": null,
"problemId": null
}
Service-control failed. Error {
"resolution": null,
"detail": [
{
"args": [
"vmware-vpostgres"
],
"id": "install.ciscommon.service.failstart",
"localized": "An error occurred while starting service 'vmware-vpostgres'",
"translatable": "An error occurred while starting service '%(0)s'"
}
],
"componentKey": null,
"problemId": null
}
C:\Program Files\VMware\vCenter Server\bin>
I was able to find this following KB after searching for failed PostgreSQL database but it did not apply to this situation:
Starting vPostgres fails after vCenter Server Appliance failure (2106584)
https://kb.vmware.com/s/article/2106584
Trying to initiate the command to start all of the services will stall and eventually fail when attempting to start services dependent on the database:
service-control --start –all
Attempting to stop all services successfully completes:
service-control --stop --all
Starting all the services again would have the process stuck on vmware-psc-client:
Eventually timing out with this output message:
Service-control failed. Error Failed to start vmon services.vmon-cli RC=1, stderr=Failed to start eam, vapi-endpoint, vsphere-client, vpxd-svcs, vsphere-ui, vmware-vpostgres services. Error: Operation timed out
From here, I navigated to the PostgreSQL logs directory:
C:\ProgramData\VMware\vCenterServer\logs\vpostgres
… opened the latest log file and found the following output:
2018-10-06 05:40:19.419 BST 5b6adb7d.1344 0 LOG: Writing instance status...
2018-10-06 05:40:19.420 BST 5b6adb7d.1344 0 LOG: Wrote instance status successfully.
2018-10-06 05:40:19.420 BST 5b6adb7d.1344 0 LOG: Updated instance status successfully.
2018-10-06 05:41:19.422 BST 5b6adb7d.1344 0 LOG: Updating instance status...
2018-10-06 05:41:19.422 BST 5b6adb7d.1344 0 LOG: Writing instance status...
2018-10-06 05:41:19.424 BST 5b6adb7d.1344 0 LOG: Wrote instance status successfully.
2018-10-06 05:41:19.424 BST 5b6adb7d.1344 0 LOG: Updated instance status successfully.
2018-10-06 05:41:32.146 BST 5bb80915.577c 0 VCDB vc LOG: duration: 20170.000 ms bind _PLAN000001331116CC90: SELECT EVENT_ID, CHAIN_ID, EVENT_TYPE, EXTENDED_CLASS, CREATE_TIME, USERNAME, CATEGORY, VM_ID, VM_NAME, HOST_ID, HOST_NAME, COMPUTERESOURCE_ID, COMPUTERESOURCE_TYPE, COMPUTERESOURCE_NAME, DATACENTER_ID, DATACENTER_NAME, DATASTORE_ID, DATASTORE_NAME, NETWORK_ID, NETWORK_NAME, NETWORK_TYPE, DVS_ID, DVS_NAME, STORAGEPOD_ID, STORAGEPOD_NAME, CHANGE_TAG_ID FROM VPXV_EVENT_ALL WHERE COMPUTERESOURCE_ID=$1 AND CREATE_TIME>=$2 AND (EVENT_TYPE IN ($3,$4,$5,$6)) ORDER BY EVENT_ID DESC LIMIT 100;
2018-10-06 05:41:32.146 BST 5bb80915.577c 0 VCDB vc DETAIL: parameters: $1 = '7', $2 = '2018-10-06 00:41:11.969+01', $3 = 'vim.event.DrsVmMigratedEvent', $4 = 'vim.event.DrsExitedStandbyModeEvent', $5 = 'vim.event.DrsVmPoweredOnEvent', $6 = 'vim.event.DrsEnteredStandbyModeEvent'
2018-10-06 05:41:41.189 BST 5bb80915.577c 0 VCDB vc LOG: duration: 9031.000 ms bind _PLAN000001331116B490: SELECT EVENT_ID, ARG_ID, ARG_TYPE, ARG_DATA, OBJ_TYPE, OBJ_NAME, VM_ID, HOST_ID, COMPUTERESOURCE_ID, DATASTORE_ID, NETWORK_ID, NETWORK_TYPE, DVS_ID, DATACENTER_ID, RESOURCEPOOL_ID, FOLDER_ID, ALARM_ID, SCHEDULEDTASK_ID FROM VPXV_EVENT_ARG WHERE (EVENT_ID IN ($1,$2,$3,$4,$5))
2018-10-06 05:41:41.189 BST 5bb80915.577c 0 VCDB vc DETAIL: parameters: $1 = '677130', $2 = '677036', $3 = '676762', $4 = '676753', $5 = '675555'
2018-10-06 05:42:19.426 BST 5b6adb7d.1344 0 LOG: Updating instance status...
2018-10-06 05:42:19.430 BST 5b6adb7d.1344 0 LOG: Writing instance status...
2018-10-06 05:42:19.431 BST 5b6adb7d.1344 0 LOG: Wrote instance status successfully.
2018-10-06 05:42:19.431 BST 5b6adb7d.1344 0 LOG: Updated instance status successfully.
2018-10-06 05:43:19.433 BST 5b6adb7d.1344 0 LOG: Updating instance status...
2018-10-06 05:43:19.433 BST 5b6adb7d.1344 0 LOG: Writing instance status...
2018-10-06 05:43:19.434 BST 5b6adb7d.1344 0 LOG: Wrote instance status successfully.
2018-10-06 05:43:19.434 BST 5b6adb7d.1344 0 LOG: Updated instance status successfully.
2018-10-06 05:44:19.436 BST 5b6adb7d.1344 0 LOG: Updating instance status...
2018-10-06 05:44:19.436 BST 5b6adb7d.1344 0 LOG: Writing instance status...
2018-10-06 05:44:19.437 BST 5b6adb7d.1344 0 LOG: Wrote instance status successfully.
2018-10-06 05:44:19.437 BST 5b6adb7d.1344 0 LOG: Updated instance status successfully.
2018-10-06 05:44:29.038 BST 5b6adb7d.1344 0 LOG: Updating instance status...
2018-10-06 05:44:29.184 BST 5b6adb7d.1c30 0 LOG: received fast shutdown request
2018-10-06 05:44:29.465 BST 5b6adb7d.1344 0 ERROR: canceling statement due to user request
2018-10-06 05:44:30.372 BST 5b6adb7d.1c30 0 LOG: aborting any active transactions
2018-10-06 05:44:33.229 BST 5b6adb7d.1fd0 0 ERROR: canceling statement due to user request
2018-10-06 05:44:33.231 BST 5bb82535.68ec 0 VCDB vc FATAL: terminating connection due to administrator command
2018-10-06 05:44:35.589 BST 5bb82535.58dc 0 VCDB vc FATAL: terminating connection due to administrator command
2018-10-06 05:44:38.297 BST 5bb82535.5160 0 VCDB vc FATAL: terminating connection due to administrator command
2018-10-06 05:44:39.128 BST 5bb82530.6420 0 VCDB vc FATAL: terminating connection due to administrator command
2018-10-06 05:44:41.974 BST 5bb80915.577c 0 VCDB vc FATAL: terminating connection due to administrator command
2018-10-06 05:44:44.535 BST 5bacb856.5f24 0 VCDB vc FATAL: terminating connection due to administrator command
2018-10-06 05:44:47.545 BST 5bacb855.62a4 0 VCDB vc FATAL: terminating connection due to administrator command
2018-10-06 05:44:50.366 BST 5b8f9b4c.5c74 0 VCDB vc FATAL: terminating connection due to administrator command
After a bit more troubleshooting from here was when I decided to check the Log on as a batch job configuration to ensure the following local server accounts were present and was able to confirm that they were not:
- cm
- content-library
- eam
- imagebuilder
- mbcs
- netdumper
- perfcharts
- rbd
- vapiEndpoint
- vmware-vpostgres
- vsan-health
- vsm
- vsphere-client
- vsphere-ui
Proceeding to add the appropriate accounts back corrected the issue:
The following is what a healthy Windows vSphere Server status should look like:
C:\Program Files\VMware\vCenter Server\bin>service-control --status
Running:
VMWareAfdService VMWareCertificateService VMWareDirectoryService VMwareComponentManager VMwareDNSService VMwareIdentityMgmtService VMwareSTS VServiceManager rhttpproxy vPostgres vapiEndpoint vimPBSM vmon vmonapi vmsyslogcollector vmware-cis-config vmware-license vmware-perfcharts vmware-psc-client vmwareServiceControlAgent vpxd vpxd-svcs vsan-health vsphere-ui vspherewebclientsvc
Stopped:
EsxAgentManager VMWareCAMService content-library mbcs vmware-autodeploy-waiter vmware-imagebuilder vmware-network-coredump
C:\Program Files\VMware\vCenter Server\bin>
Note that having the PostgreSQL database up will still throw an error when you attempt to test the connection:
FATAL: password authentication failed for user “vc”


No comments:
Post a Comment